
Tracking State Trends Over Time: Economic Security in NY Counties
Digital Briefs
June 24, 2025
By: Rimsha Khan, Shibani Chakravorty, Julie Kronick, & Robert Guttersohn
New York is a state of vast diversity – rural, suburban, urban – all carrying different rhythms, histories, and community identities. Some counties show signs of institutional investment: steadier incomes, stronger infrastructure, more consistent access to services. Others face long-standing structural barriers like child poverty, housing instability, or limited access to care and opportunity.
In this Digital Brief series, we’re looking at data over time for New York State child and family well-being using CCC’s State Indices, specifically between 2020-2024, across the state’s 62 counties. Drawing from the American Community Survey, we assess key indicators across six domains- economic security, housing, health, education, youth, and community. Understanding the trends covered in this brief helps understand both persistent disparities and areas of progress. This can guide more equitable investments and policy decisions to ensure that every child, in every county, has the opportunity to grow up safe, healthy, and housed.
Our latest Child and Family Well-being Index for 2025 is available to read here.
This brief will go over economic security indicator trends.
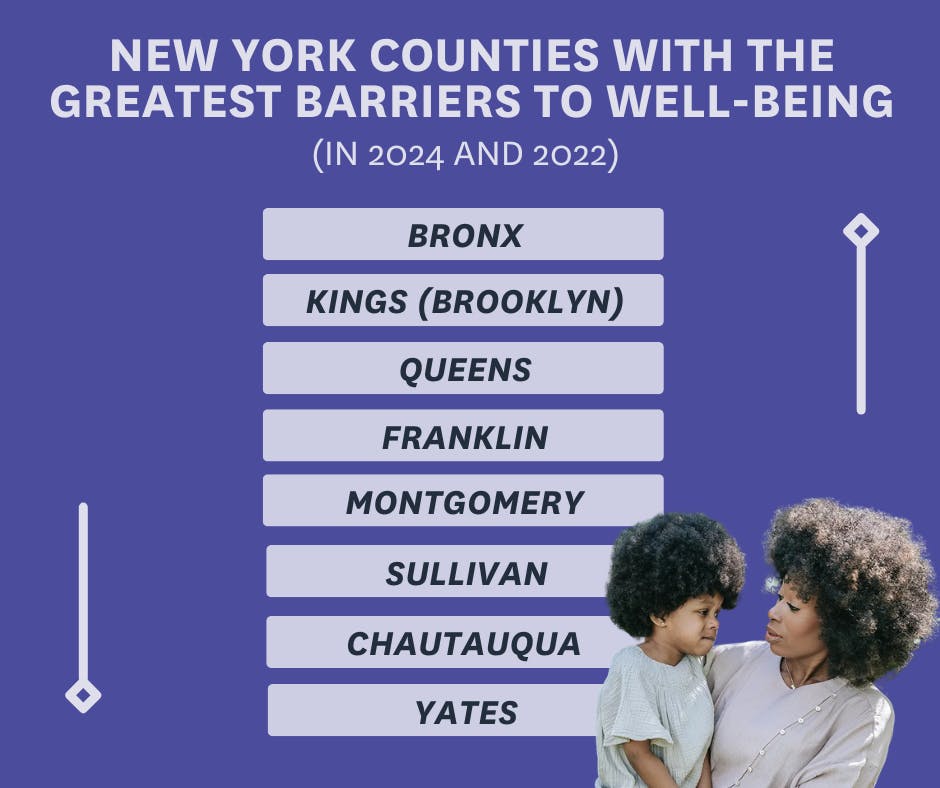
The above graphic details the top 8 counties with the greatest barriers to well-being overall in both 2024 and 2022. These counties in order are Bronx, Kings (Brooklyn), Queens, Franklin, Montgomery, Sullivan, Chautauqua, Yates. What trends can we take from this data?
- Bronx and Kings remain at the top of the ranking in both years, signaling persistent challenges in these counties.
- The Overall Index Scores declined across the board, indicating slight improvements in county conditions.*
- All five upstate counties are rural or small-town communities that have struggled with economic decline, healthcare access, and education disparities.
According to the latest Census Bureau estimates, approximately 731,000 New York children live in households earning below the federal poverty level—about $27,750 for a family of four in 2022. The overall child poverty rate for New York State is 18%; however, in 20 different counties more than 20% of children live in households below the federal poverty level.
Given the state’s higher-than-average (national) cost of living, many families navigate financial challenges beyond what federal poverty estimates capture. Notably, in counties where there are greater economic security barriers, most families (85–90%) are employed or actively seeking work, indicating low wages that are not able to support economic stability.
The following data charts show economic security trends CCC has recorded using our statewide indices data from 2020 to 2024.
(Select county name for individual display)
Largest Increase in Economic Security Well-being:
Montgomery County saw the most significant child poverty reduction and income growth
Child Poverty Rate in Montgomery County from 2020 to 2024
Median Income Among Households with Children in Montgomery County from 2020 to 2024
Continued High Poverty/Economic Security Barriers:
Bronx County still has the highest child poverty rate, but it’s declining
Child Poverty Rate in The Bronx from 2020 to 2024
Median Income Among Families with Children in The Bronx from 2020 to 2024
Economic Growth Leaders:
Queens and Brooklyn (Kings County) are seeing consistent poverty reduction and rising incomes
Child Poverty Rate in Queens and Kings County from 2020 to 2024
Median Income Among Families with Children in Queens and Kings County from 2020 to 2024
Fluctuation in Sullivan & Yates:
Sullivan and Yates counties have fluctuating child poverty rates
This is possibly due to dependence on seasonal industries
Child Poverty Rate in Sullivan and Yates County from 2020 to 2024
Mixed Trends in Franklin & Chautauqua:
Franklin and Chautauqua Counties saw income growth among families but child poverty did not decline at the same rate
Child Poverty Rate in Franklin and Chautauqua Counties from 2020 to 2024
Median Income Among Households with Children in Franklin and Chautauqua Counties from 2020 to 2024
Tracking household economic security is useful in understanding how basic needs for children are being met and as a baseline for where targeted investments from elected leaders are needed to address inequity. In this way, it is also a foundational metric for understanding and addressing child poverty. Monitoring these changes over time can help us understand what policies may be working to reduce child poverty, where more investment is needed, and what factors influence barriers to well-being.
Though this data can help us understand general trends and identify disparities that warrant deeper understanding, it is crucial to be mindful that challenges alone don’t tell the full story. Many places facing long-standing barriers also happen to be sites of deep resilience – where connection, care, and resourcefulness are woven into daily life. This brief is heavily focused on the indicators in alignment with the publicly provided data. Yet as we zoom into many barrier-focused indicators, we wanted to hold space to honor the unmeasured, the stories we haven’t laid out, i.e. the ways in which communities are already holding each other up.
As part of a larger narrative, data analysis is critical in influencing and informing our understandings of how policy decisions can impact the real issues families and children face. In this past budget cycle, two key child poverty reduction investments were included: enhancing the Empire State Tax Credit to $1,000 for children under 4 and $500 for children ages 4-17, beginning next year; and fully funding a statewide Healthy School Meals program. Both investments are meant to support child poverty reduction efforts outlined in the Child Poverty Reduction Act and we will be monitoring the impact they have on child well-being through our future work.
Stay tuned for more Digital Briefs from this lookback series.
Topics to come: Housing, Health, Education, Youth, and Community.
For more on recent statewide data, read through The Road to Equity: Child & Family Well-being in New York State 2025.
View the Index >* This report analyzes data from the U.S. Census Bureau and various New York State agencies. To describe how different counties compare, we used the terms “greatest (above average) barriers to well-being” and “fewest (below average) barriers to well-being.” These reflect the cumulative level of challenges or supports children and families face in different regions.
